
Farm to School Census Results Overview
Explore the landscape of farm to school activity across the country. Want to know more about how farm to school is being cultivated in your State? Select a State or SFA using the search tools below and dig deeper into what is going on in your community. You can also learn more about the Census data and how we gathered it.
Also check out the interactive maps below with key highlights from the 2019 Farm to School Census.
Overall Key Census Findings
Learn more about top findings from the Farm to School Census.
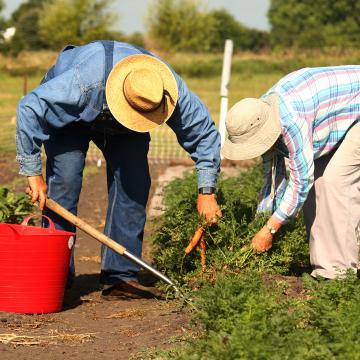
SFAs using local food in school year 2018-2019
SFAs report using local food in a variety of Child Nutrition Programs. Using local foods at lunch was most commonly reported.
12,334 Schools
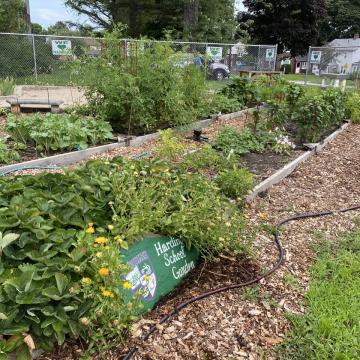
Schools with edible gardens
One third of responding SFAs operate edible gardens where food is grown. Gardens are a popular way to teach students where their food comes from, to inspire youth toward careers in agriculture, and to produce food for use in Child Nutrition Program meals or snacks.
National spending on local foods by SFAs
Farm to school SFAs estimated that they spent about 20 cents of every food dollar to buy local food during the 2018-2019 school year.
States across the nation are featuring local foods on their school menus
This data reflects the percent of responding school food authorities (SFAs) participating in farm to school that reported serving local food in school meals in each State.
The map is loading...
Farm to school isn’t just about what is on the lunch tray
This data shows the different strategies that responding school food authorities (SFAs) participating in farm to school use to teach children about food, nutrition, and agriculture and how many SFAs use these strategies
| Percent of F2S SFAs | Total F2S SFAs | ||
|---|---|---|---|
| Hold taste tests & cooking demos | 33.5% |
4,128 | |
| Use USDA Team Nutrition materials | 11.8% |
1,457 | |
| Use educational edible school garden | 20.9% |
2,573 | |
| Hold student field trips to farms | 30.7% |
3,776 | |
| Have Farmers Visit | 15.3% |
1,879 | |
| Do farm to school activities in pre-K | 12.9% |
1,593 |
Edible school gardens are growing in States across the country
This data reflects the percent of responding school food authorities (SFAs) participating in farm to school that reported operating food producing gardens in each State.
The map is loading...